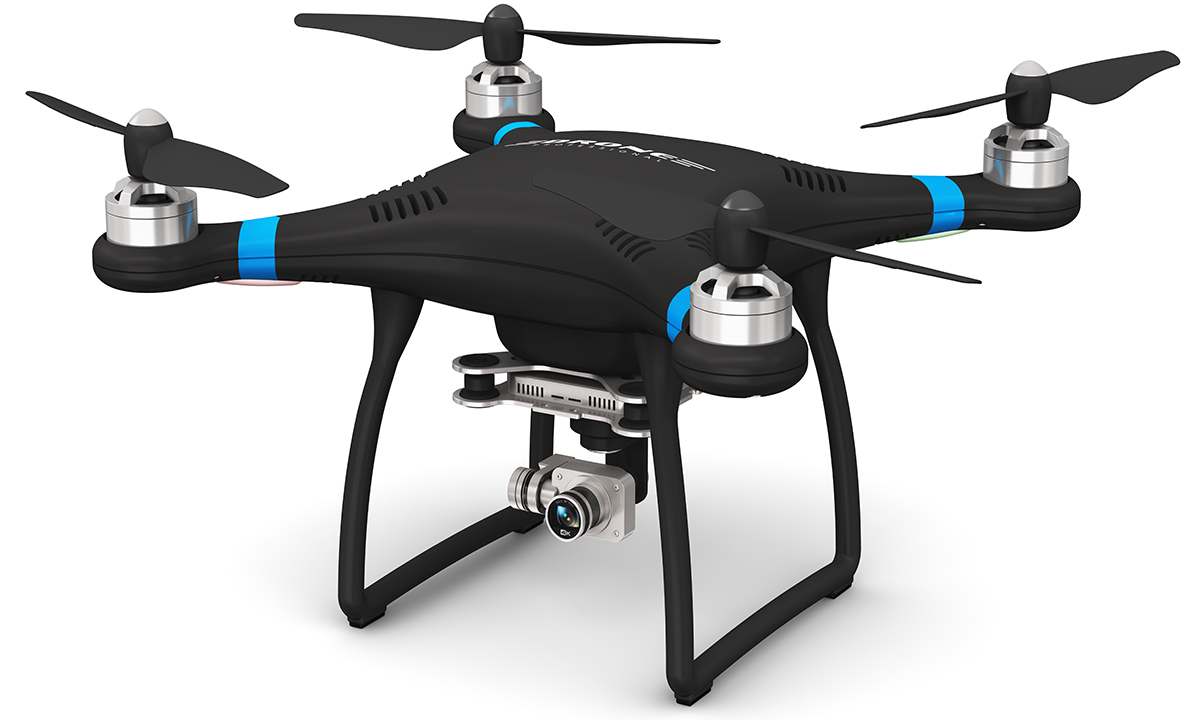
Preparing to launch...

Preparing to launch...
Automatically detect and isolate areas of concern to direct your resources where it matters most. We allow you to optimize treatment zones based on robust statistical analysis, saving you time and increasing overall maintenance efficiency.
Save time and money by spotting — and mitigating — watering and turf health issues before they become visible to the naked eye.
High resolution multispectral imagery and powerful analytics provide actionable insights into your turf health, moisture conditions, and stress patterns.
Handheld and ground based sensors don’t give you the complete picture.
Thermal imaging and analytics reveal where you may be over or under watering across your entire property.
Implement a targeted moisture monitoring program to know where to follow-up with handheld devices and ground truth your drone analysis results. After some time, you’ll form a synergy with the drone data that will help you achieve operational efficiency.
Drone based inspection gives you high resolution, multispectral data that covers every square inch of your course. Our platform serves as the command center for your data-driven maintenance operations.
Use automated hotspot detection to isolate treatment zones and commit your resources where they are needed the most.
Use our side-by-side comparison tool to track regressions, improvements, and patterns over time. Conduct field trials and measure the results with rich KPIs, charts, and maps. Additionally, identify patterns caused by golfer traffic, cart traffic, and maintenance equipment.
Filter your data by turf type, and sort by health, moisture, and thermal metrics to prioritize areas that need the most attention.
This solution isn’t just a powerful tool for superintendents and groundskeepers.
Easily add users to the system so that owners, board members, and greens committees can share reports and make data-driven decisions when implementing maintenance plans and budgeting.
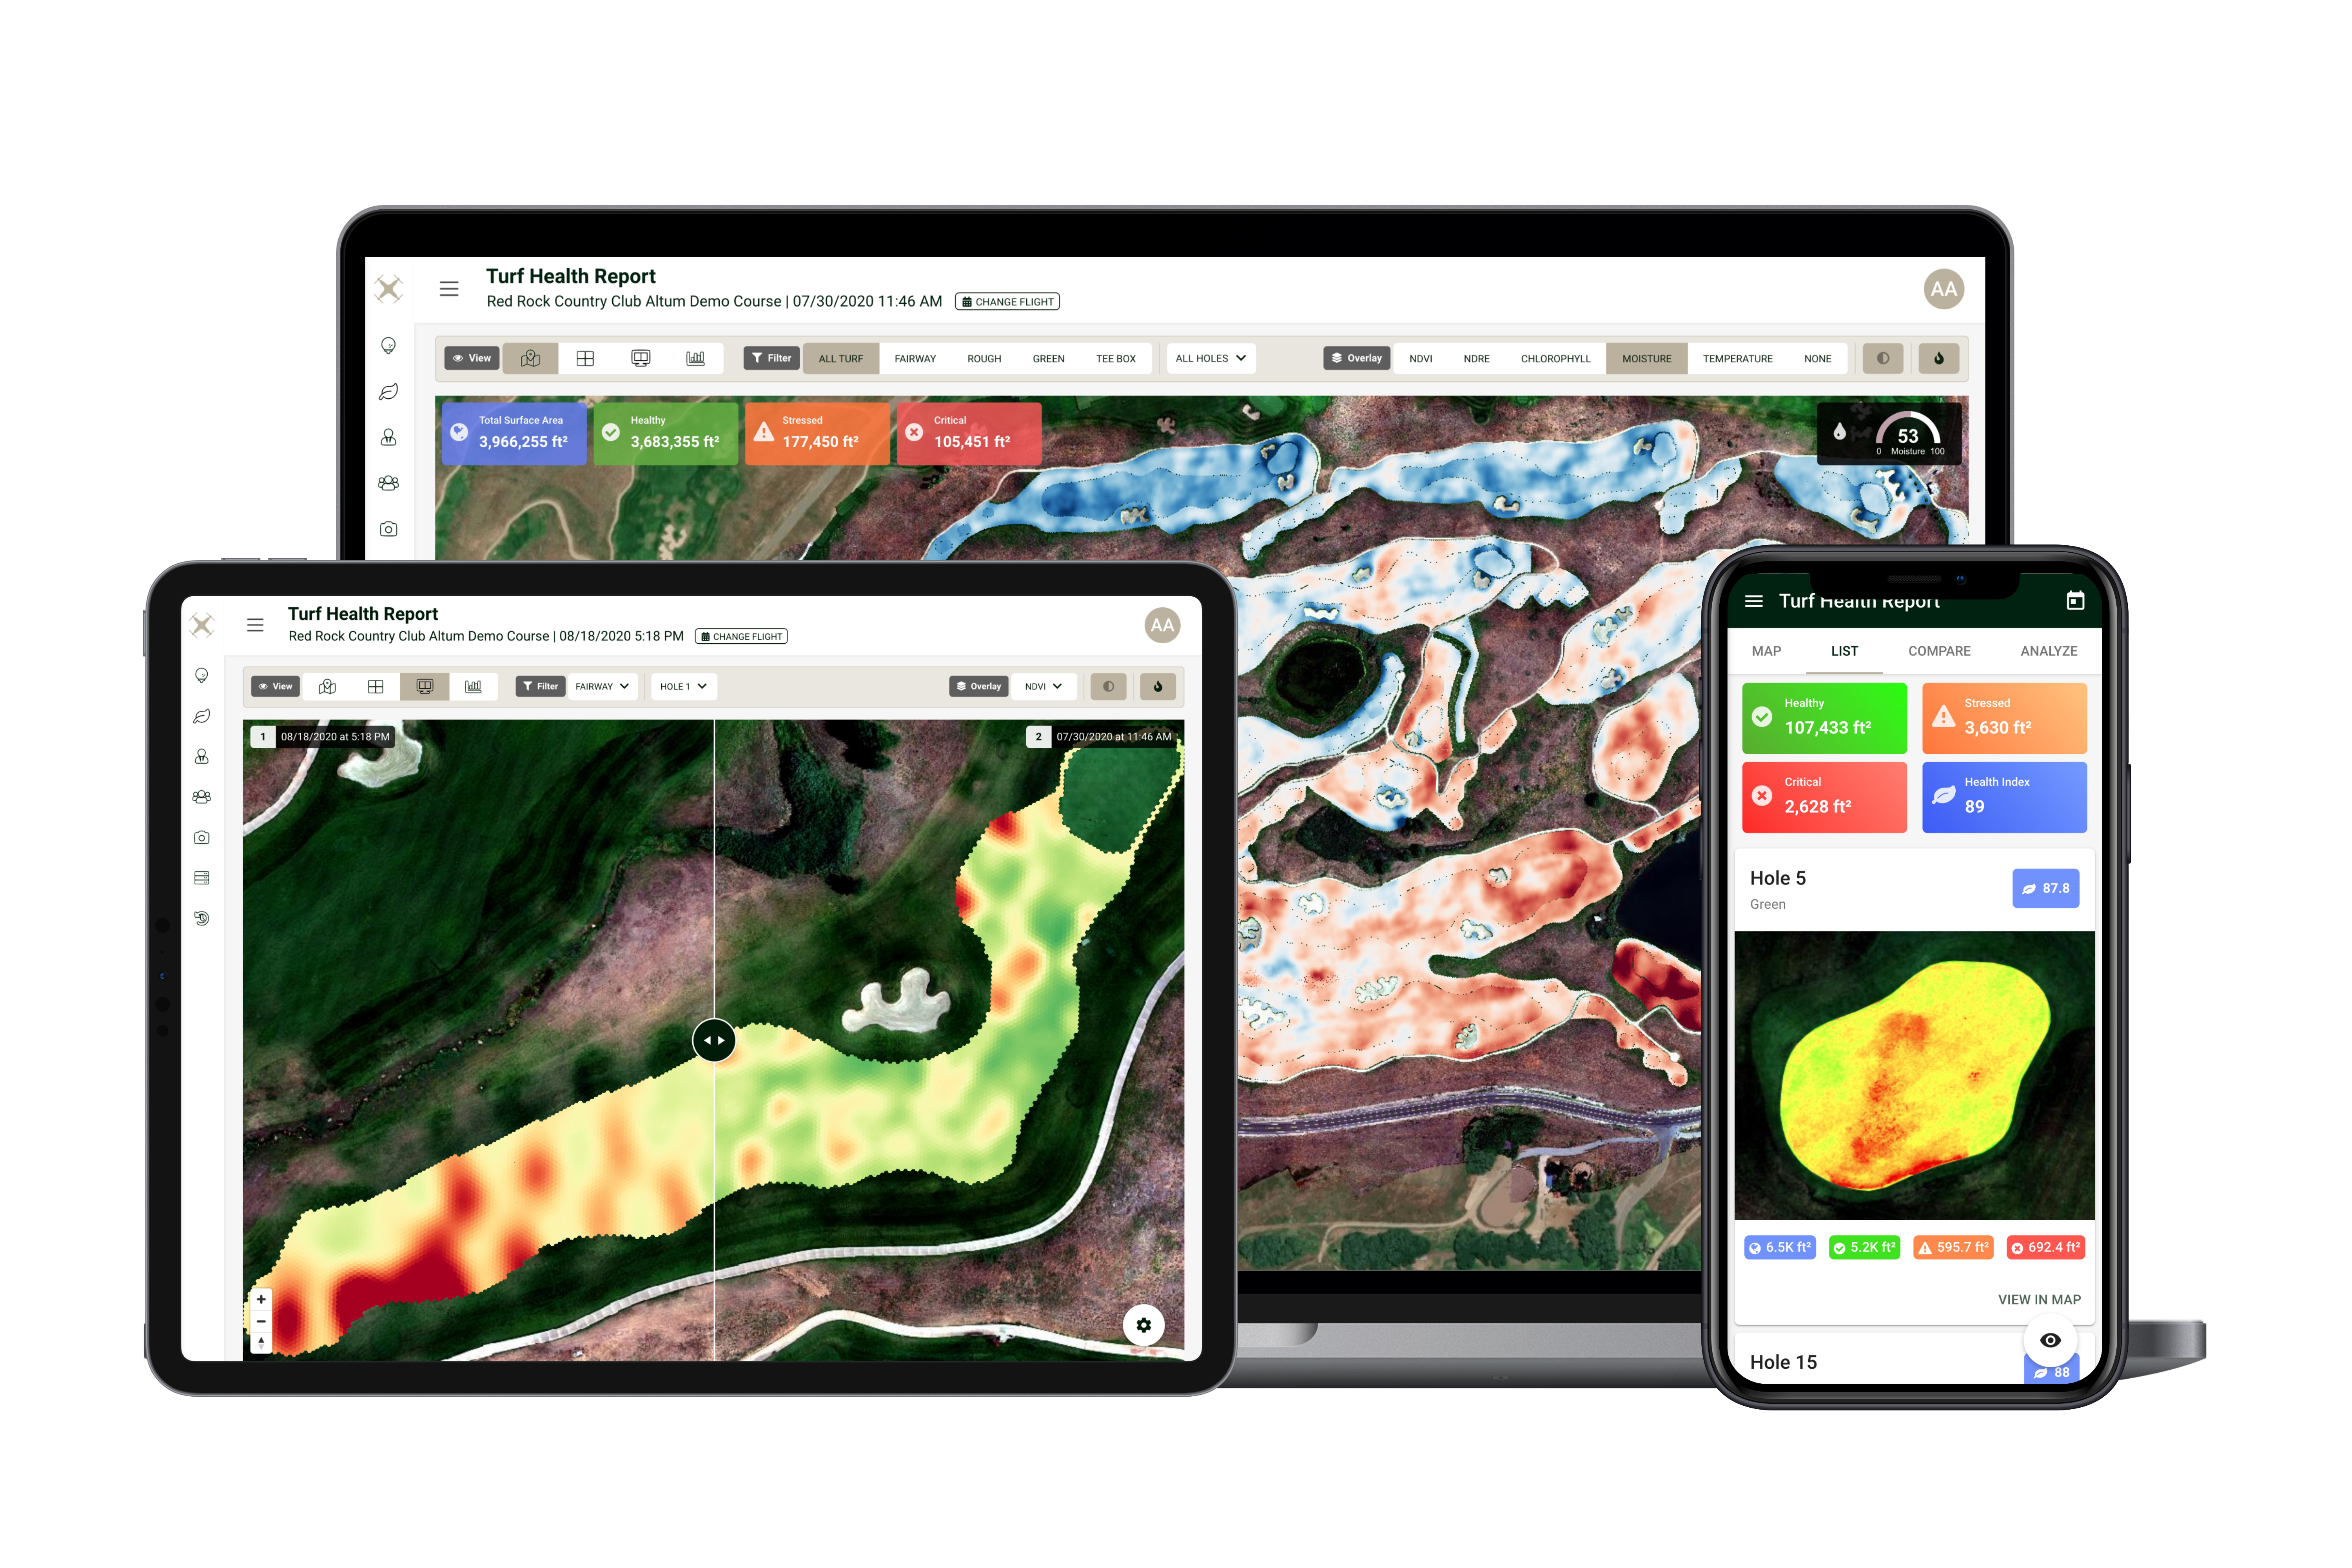
Data is available where you need it – on your workstation, tablet, or mobile device.
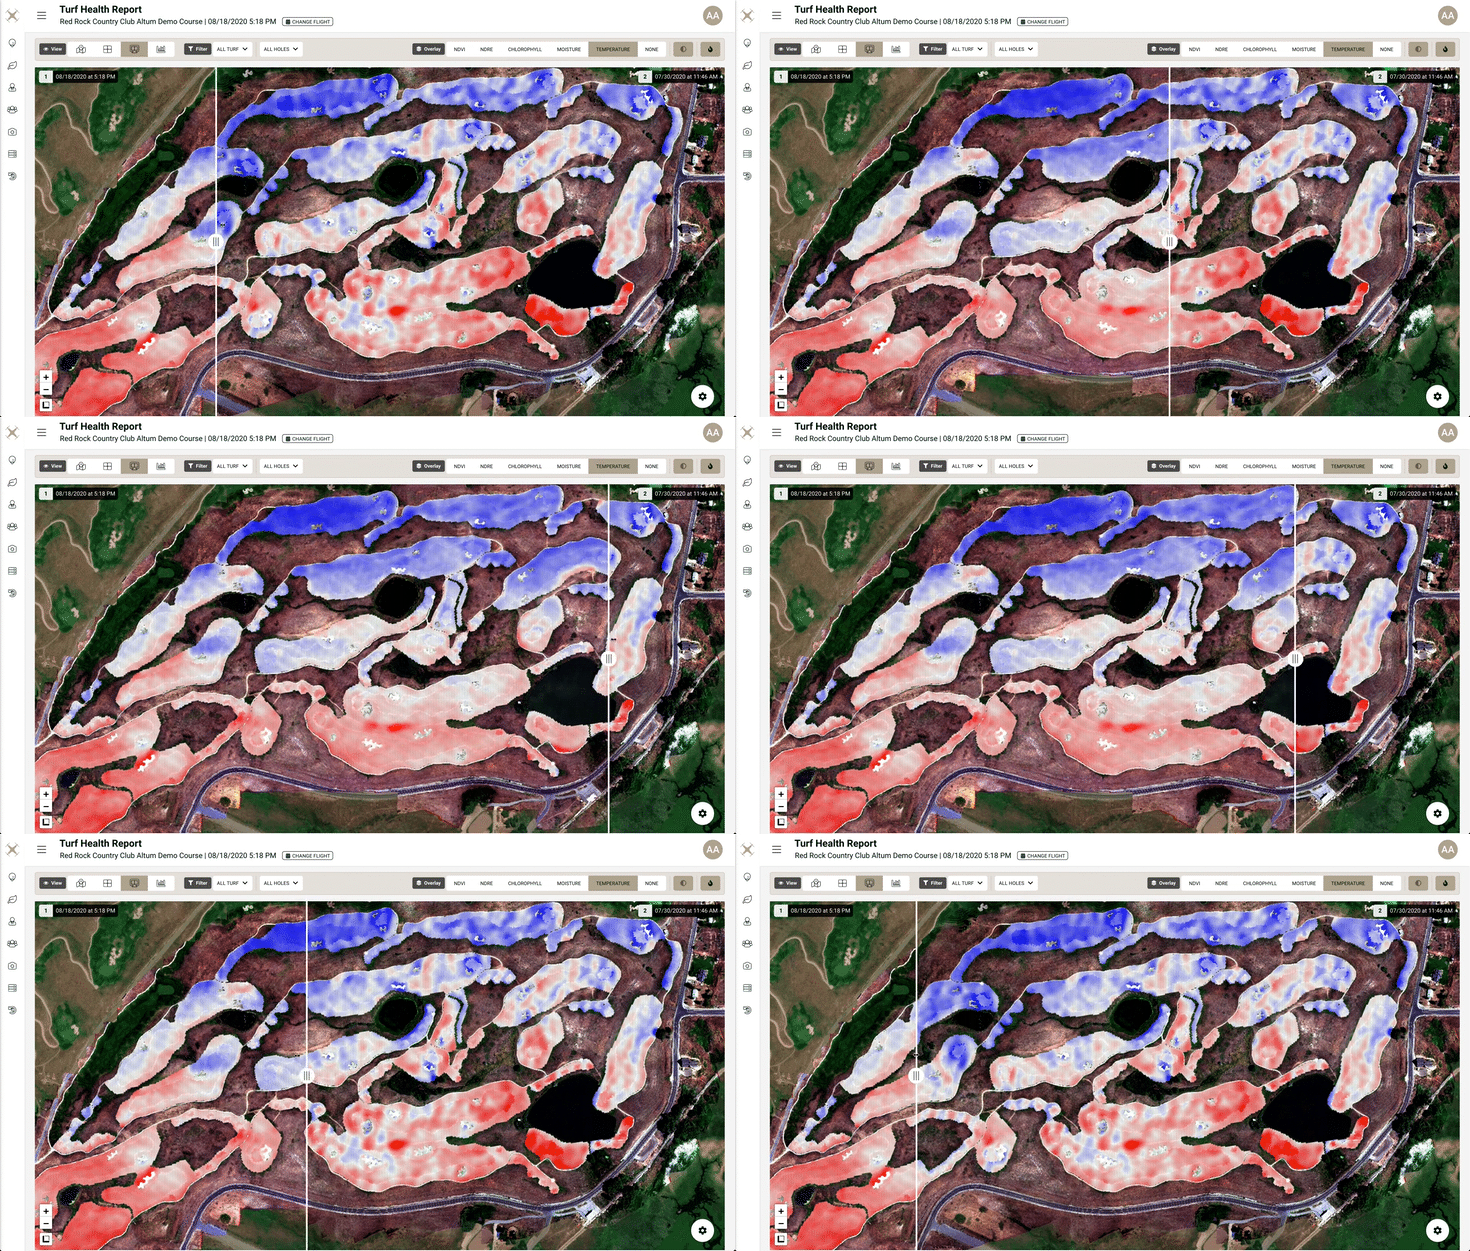
Use the built-in slider to compare two datasets (flights) and track the results of your efforts side-by-side.
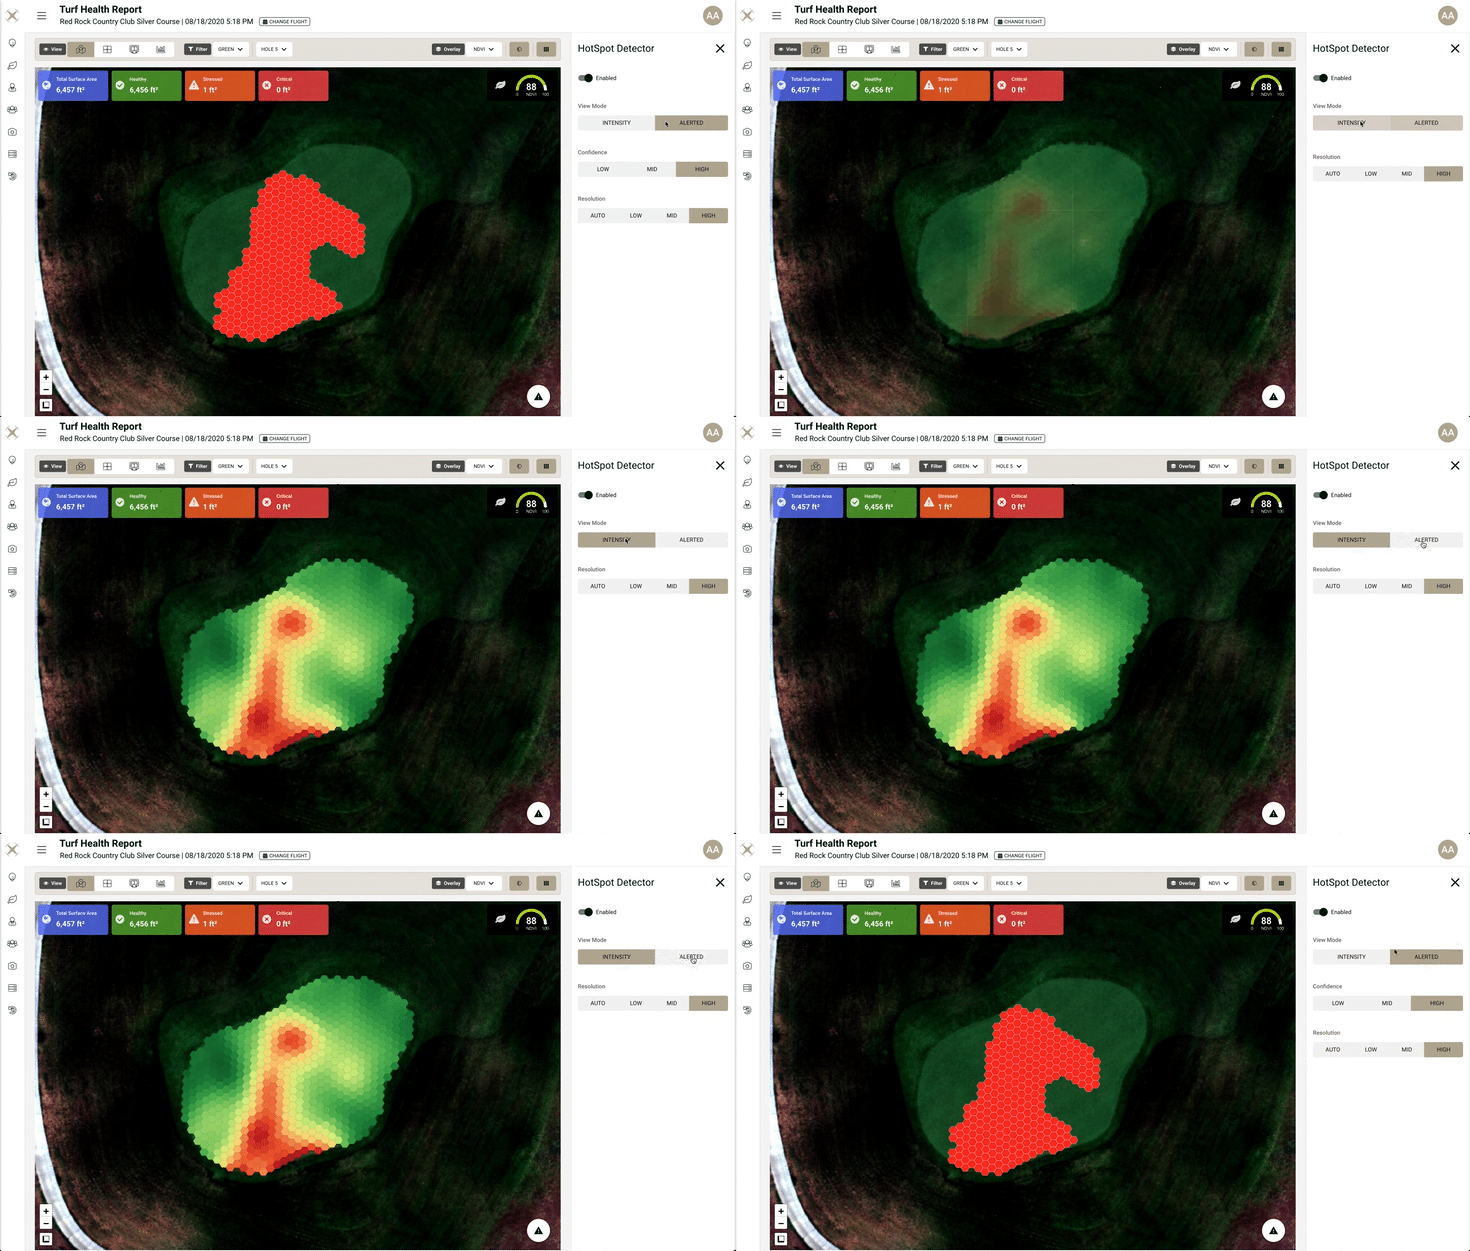
Hot spot detection lets you zero in on areas on concern and focus the resources needed to correct the problem.
1 Course
28 Datasets Per Year – A flight every 14 days
Full Platform Access
Course Setup Included
Zone Based Turf Analysis
Hot Spot Detection
Interactive Reports
PDF Reports
User Management
1 Course
100 Datasets Per Year -a flight every 4 days
Full Platform Access
Course Setup Included
Zone Based Turf Analysis
Hot Spot Detection
Interactive Reports
PDF Reports
User Management
